MLGM
Multivariate Longitudinal Graphical Modeling of Mean and Covariance
This project is maintained by priyakohli5
MLGM
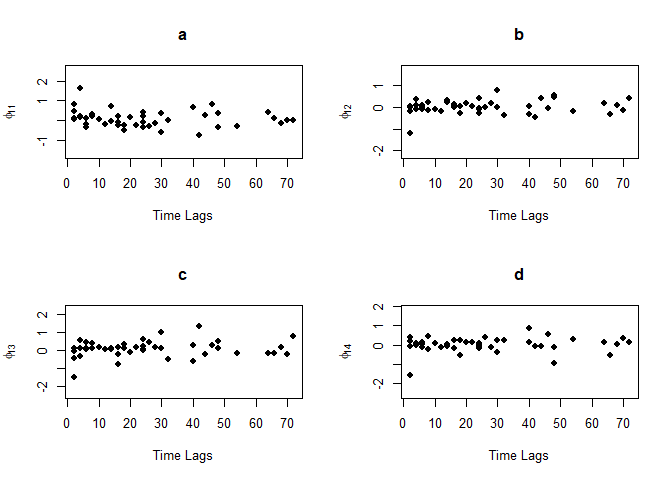
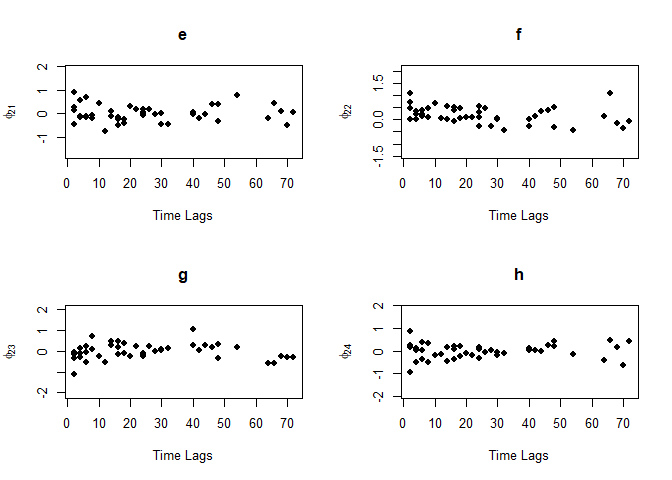
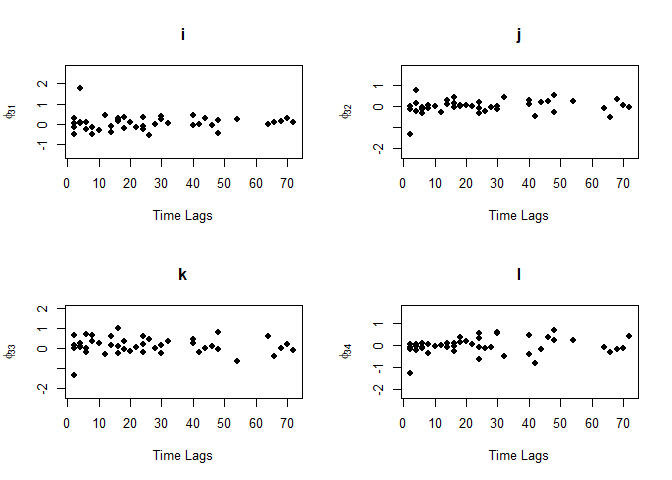
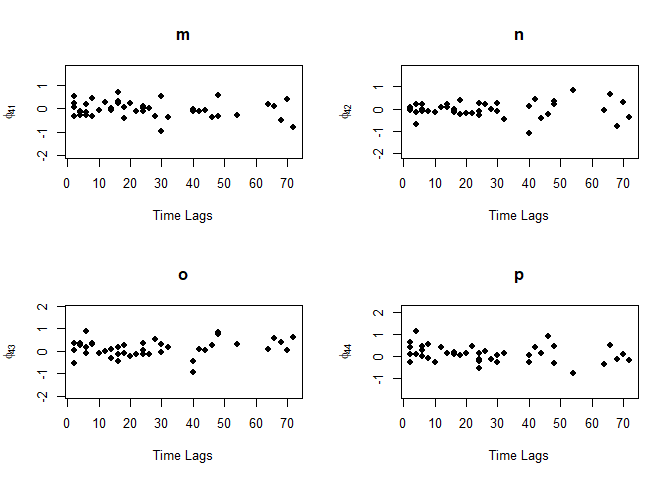
Joint mean-covariance modeling of multiple longitudinal data helps with understanding the trends and dependence patterns among repeatedly measured outcomes. This R implements functions to profile plots and multivariate regressograms using modified Cholesky block decompisition of the covariance matrix. In addition to visualizing the existing patterns, this package provides ways to model mean and covariance for variables measured at regular or irregular time points and it guarantees the positive definiteness of the estimated covariance. The corresponding references are:
Installation
You can install the released version of MLGM from GitHub with:
# install.packages("devtools")
devtools::install_github("priyakohli5/MLGM", force=TRUE)
Example
Here are examples for different functions in this R package:
library(MLGM)
data(Tcells)
time <- c(0, 2, 4, 6, 8, 18, 24, 32, 48, 72)
j <- 4
n <- 44
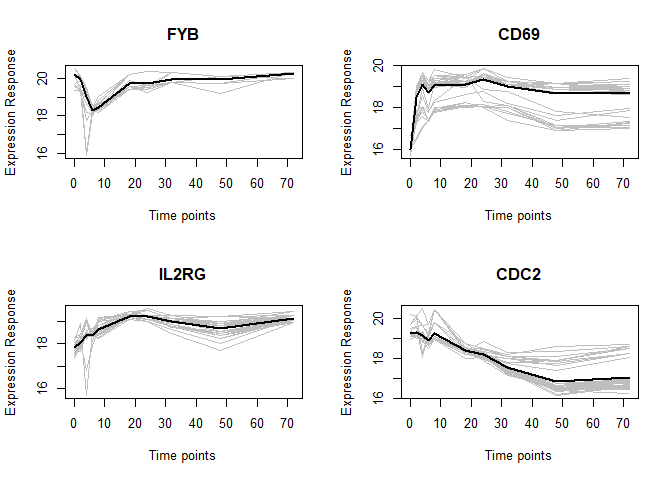
gene.names <- c("FYB", "CD69", "IL2RG", "CDC2")
par(mfrow=c(2,2))
for(i in 1:j){
mvp(Tcells[,seq(i, ncol(Tcells), j)],time,mean=TRUE,title=gene.names[i],xlabel="Time points",ylabel="Expression Response",scol="gray",mcol="black",plot=TRUE,lwd.mean=2)
}
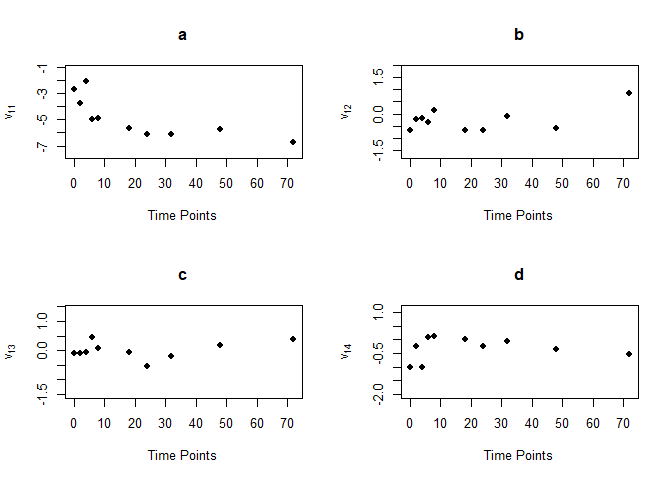
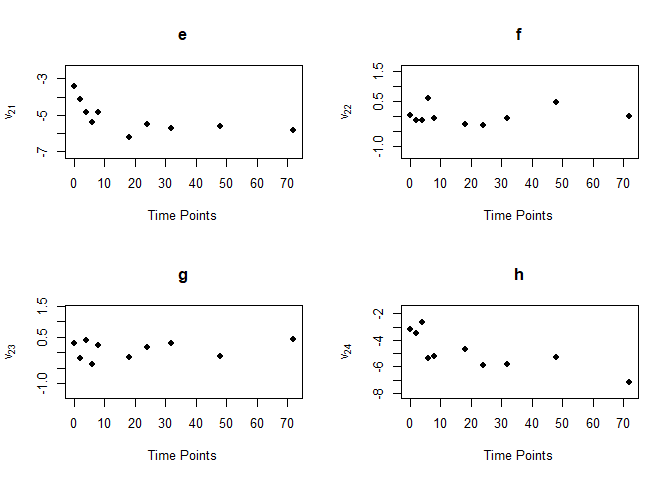
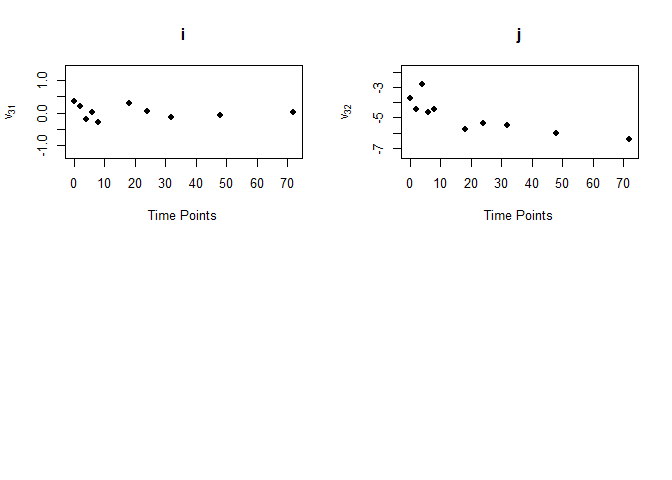
MVR <- mvr(Tcells,time,j,n,inno=FALSE,inverse=FALSE,loginno=TRUE,plot=TRUE,pch.plot=19,par1.r = 2,par2.r = 2,par1.d=2,par2.d=2)